1. Introduction
Loki, a product of Grafana Labs, is an open-source log aggregation system. It’s designed to store and index log data, making it easier to query and analyze logs from various applications and systems.
In this tutorial, we’ll setup Spring Boot logging with Loki. Grafana Loki will be responsible for collecting and aggregating the logs, while we can visualize the logs in Grafana Dashboard.
2. Setting Up Loki and Grafana Services
The first step is to get Loki and Grafana services up and running. We’ll use Docker containers for this, as they simplify the configuration and execution process.
Here’s a docker-compose.yml file to set up Loki and Grafana services:
version: "3"
services:
  loki:
    image: grafana/loki:2.9.0
    ports:
      - "3100:3100"
    command: -config.file=/etc/loki/local-config.yaml
  grafana:
    image: grafana/grafana:latest
    ports:
      - "3000:3000"
    environment:
      - GF_PATHS_PROVISIONING=/etc/grafana/provisioning
      - GF_AUTH_ANONYMOUS_ENABLED=true
      - GF_AUTH_ANONYMOUS_ORG_ROLE=Admin
    entrypoint:
      - /bin/sh
      - -c
      - |
        mkdir -p /etc/grafana/provisioning/datasources
        echo "
        apiVersion: 1
        datasources:
        - name: Loki
          type: loki
          access: proxy
          orgId: 1
          url: http://loki:3100
          basicAuth: false
          isDefault: true
          version: 1
          editable: false
        " > /etc/grafana/provisioning/datasources/ds.yaml
        /run.sh
To start the services, use the docker-compose command:
docker-compose upTo verify if the services are running, use the docker ps command:
docker psBy now, we should see something like this:
CONTAINER ID   IMAGE                    COMMAND                  CREATED          STATUS          PORTS                    NAMES
211c526ea384   grafana/loki:2.9.0       "/usr/bin/loki -conf…"   1 days ago       Up 38 seconds   0.0.0.0:3100->3100/tcp   loki_1
a1b3b4a4995f   grafana/grafana:latest   "/run.sh"                1 days ago       Up 38 seconds   0.0.0.0:3000->3000/tcp   grafana_1
This confirms that both Loki and Grafana services are up and running.
3. Spring Boot Logging with Loki
After getting Grafana and Loki services up and running, the next step is to configure our Spring Boot application to send logs to Loki. For this, we’ll use the loki-logback-appender, which will send the logs to Loki for storage and indexing.
3.1. Grafana Loki configuration
The first step is to add the loki-logback-appender dependency in the pom.xml file:
<dependency>
    <groupId>com.github.loki4j</groupId>
    <artifactId>loki-logback-appender</artifactId>
    <version>1.4.1</version>
</dependency>
Next, we need to create a logging-spring.xml file in the src/main/resources directory. This file will control the logging in Spring Boot application, such as the log format and the Loki service endpoint, etc.:
<?xml version="1.0" encoding="UTF-8"?>
<configuration>
   <appender name="LOKI" class="com.github.loki4j.logback.Loki4jAppender">
        <http>
            <url>http://localhost:3100/loki/api/v1/push</url>
        </http>
        <format>
            <label>
                <pattern>app=${name},host=${HOSTNAME},level=%level</pattern>
                <readMarkers>true</readMarkers>
            </label>
            <message>
                <pattern>
                    {
                    "level":"%level",
                    "class":"%logger{36}",
                    "thread":"%thread",
                    "message": "%message",
                    "requestId": "%X{X-Request-ID}"
                    }
                </pattern>
            </message>
         </format>
     </appender>

     <root level="INFO">
        <appender-ref ref="LOKI" />
     </root>
</configuration>
After setting up, let’s create a simple service that logs data at the INFO level:
@Service
public class SampleService{

    private final Logger LOG = LoggerFactory.getLogger(SampleService.class);

    public void logInfo(){
        LOG.info("SampleService.logInfo invoked");
    }
}
4. Running the Tests
We’re going to do a live test by starting Grafana and Loki containers, and then we’ll run a service method to send the logs to Loki. We’ll then ask Loki using the HTTP API to make sure the log was sent.
First, we’ll run the SampleService.logInfo() method, which will trigger Logger.info(). This sends a message using the loki-logback-appender, which Loki will gather:
SampleService service = new SampleService();
service.logInfo();
Next, we’ll make a request to call the REST endpoint given by the Loki HTTP API. This GET API takes query parameters that represent the query, start time, and end time. We’ll include those parameters in our request object:
HttpHeaders headers = new HttpHeaders();
headers.setContentType(MediaType.APPLICATION_JSON);

String query = "{level=\"INFO\"} |= `SampleService.logInfo invoked`";

// Get time in UTC
LocalDateTime currentDateTime = LocalDateTime.now(ZoneOffset.UTC);
String current_time_utc = currentDateTime.format(DateTimeFormatter.ofPattern("yyyy-MM-dd'T'HH:mm:ss'Z'"));

LocalDateTime tenMinsAgo = currentDateTime.minusMinutes(10);
String start_time_utc = tenMinsAgo.format(DateTimeFormatter.ofPattern("yyyy-MM-dd'T'HH:mm:ss'Z'"));

URI uri = UriComponentsBuilder.fromUriString(baseUrl)
  .queryParam("query", query)
  .queryParam("start", start_time_utc)
  .queryParam("end", current_time_utc)
  .build()
  .toUri();
We’ll use the request object to call the REST request:
RestTemplate restTemplate = new RestTemplate();
ResponseEntity<String> response = restTemplate.exchange(uri, HttpMethod.GET, new HttpEntity<>(headers), String.class);
We need to handle the response and extract the log messages that we want. We’ll use an ObjectMapper to read the JSON response and extract the log messages:
ObjectMapper objectMapper = new ObjectMapper();
List<String> messages = new ArrayList<>();
String responseBody = response.getBody();
JsonNode jsonNode = objectMapper.readTree(responseBody);
JsonNode result = jsonNode.get("data")
  .get("result")
  .get(0)
  .get("values");

result.iterator()
  .forEachRemaining(e -> {
      Iterator<JsonNode> elements = e.elements();
      elements.forEachRemaining(f -> messages.add(f.toString()));
  });
Finally, let’s check that the messages we received in the response contains the message that was logged by the SampleService:
assertThat(messages).anyMatch(e -> e.contains(expected));5. Visualizing Logs in Grafana Dashboard
Our service logs are sent to the Loki service because of the configuration setup with the loki-logback-appender. We can actually see it by visiting http://localhost:3000 in our browser (where the Grafana service is deployed and started).
To see logs that have been saved and indexed in Loki, we need to use Grafana. The Grafana datasource gives adjustable connection parameters which can be configured for Loki where we need to update the Loki endpoint, authentication mechanism, and more.
First, let’s setup the Loki endpoint to which logs have been sent to:
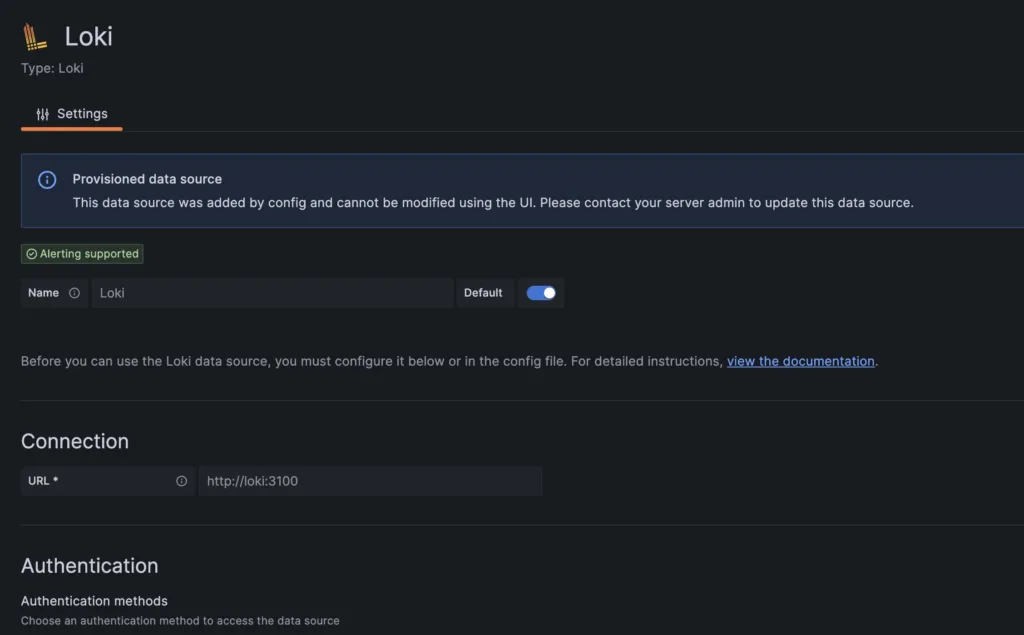
After we’ve set up the data source correctly, it’s time to check out the data page to search our logs:
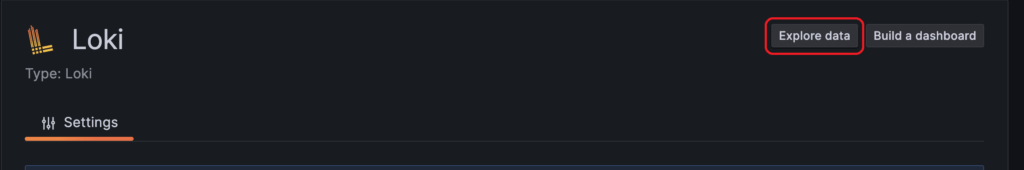
We can create a query to pull the logs into Grafana for a visual display. In our SampleService, we’re sending INFO logs, so we need to include that in our filter and execute the query. When we run the query, we’ll see all the INFO logs that match our search criteria.
6. Conclusion:
In this tutorial, we have configured logging for a Spring Boot application with Grafana Loki. We also confirmed our setup with a unit test and visualization, by logging INFO logs using straightforward logic and establishing a Loki data source in Grafana.